Map every React page. Highlight every component, live.
page-dep-map statically analyzes your React / Next.js pages, scores complexity, finds drilled props, and lets you click any component in the dashboard to light it up on the running app — in real time.
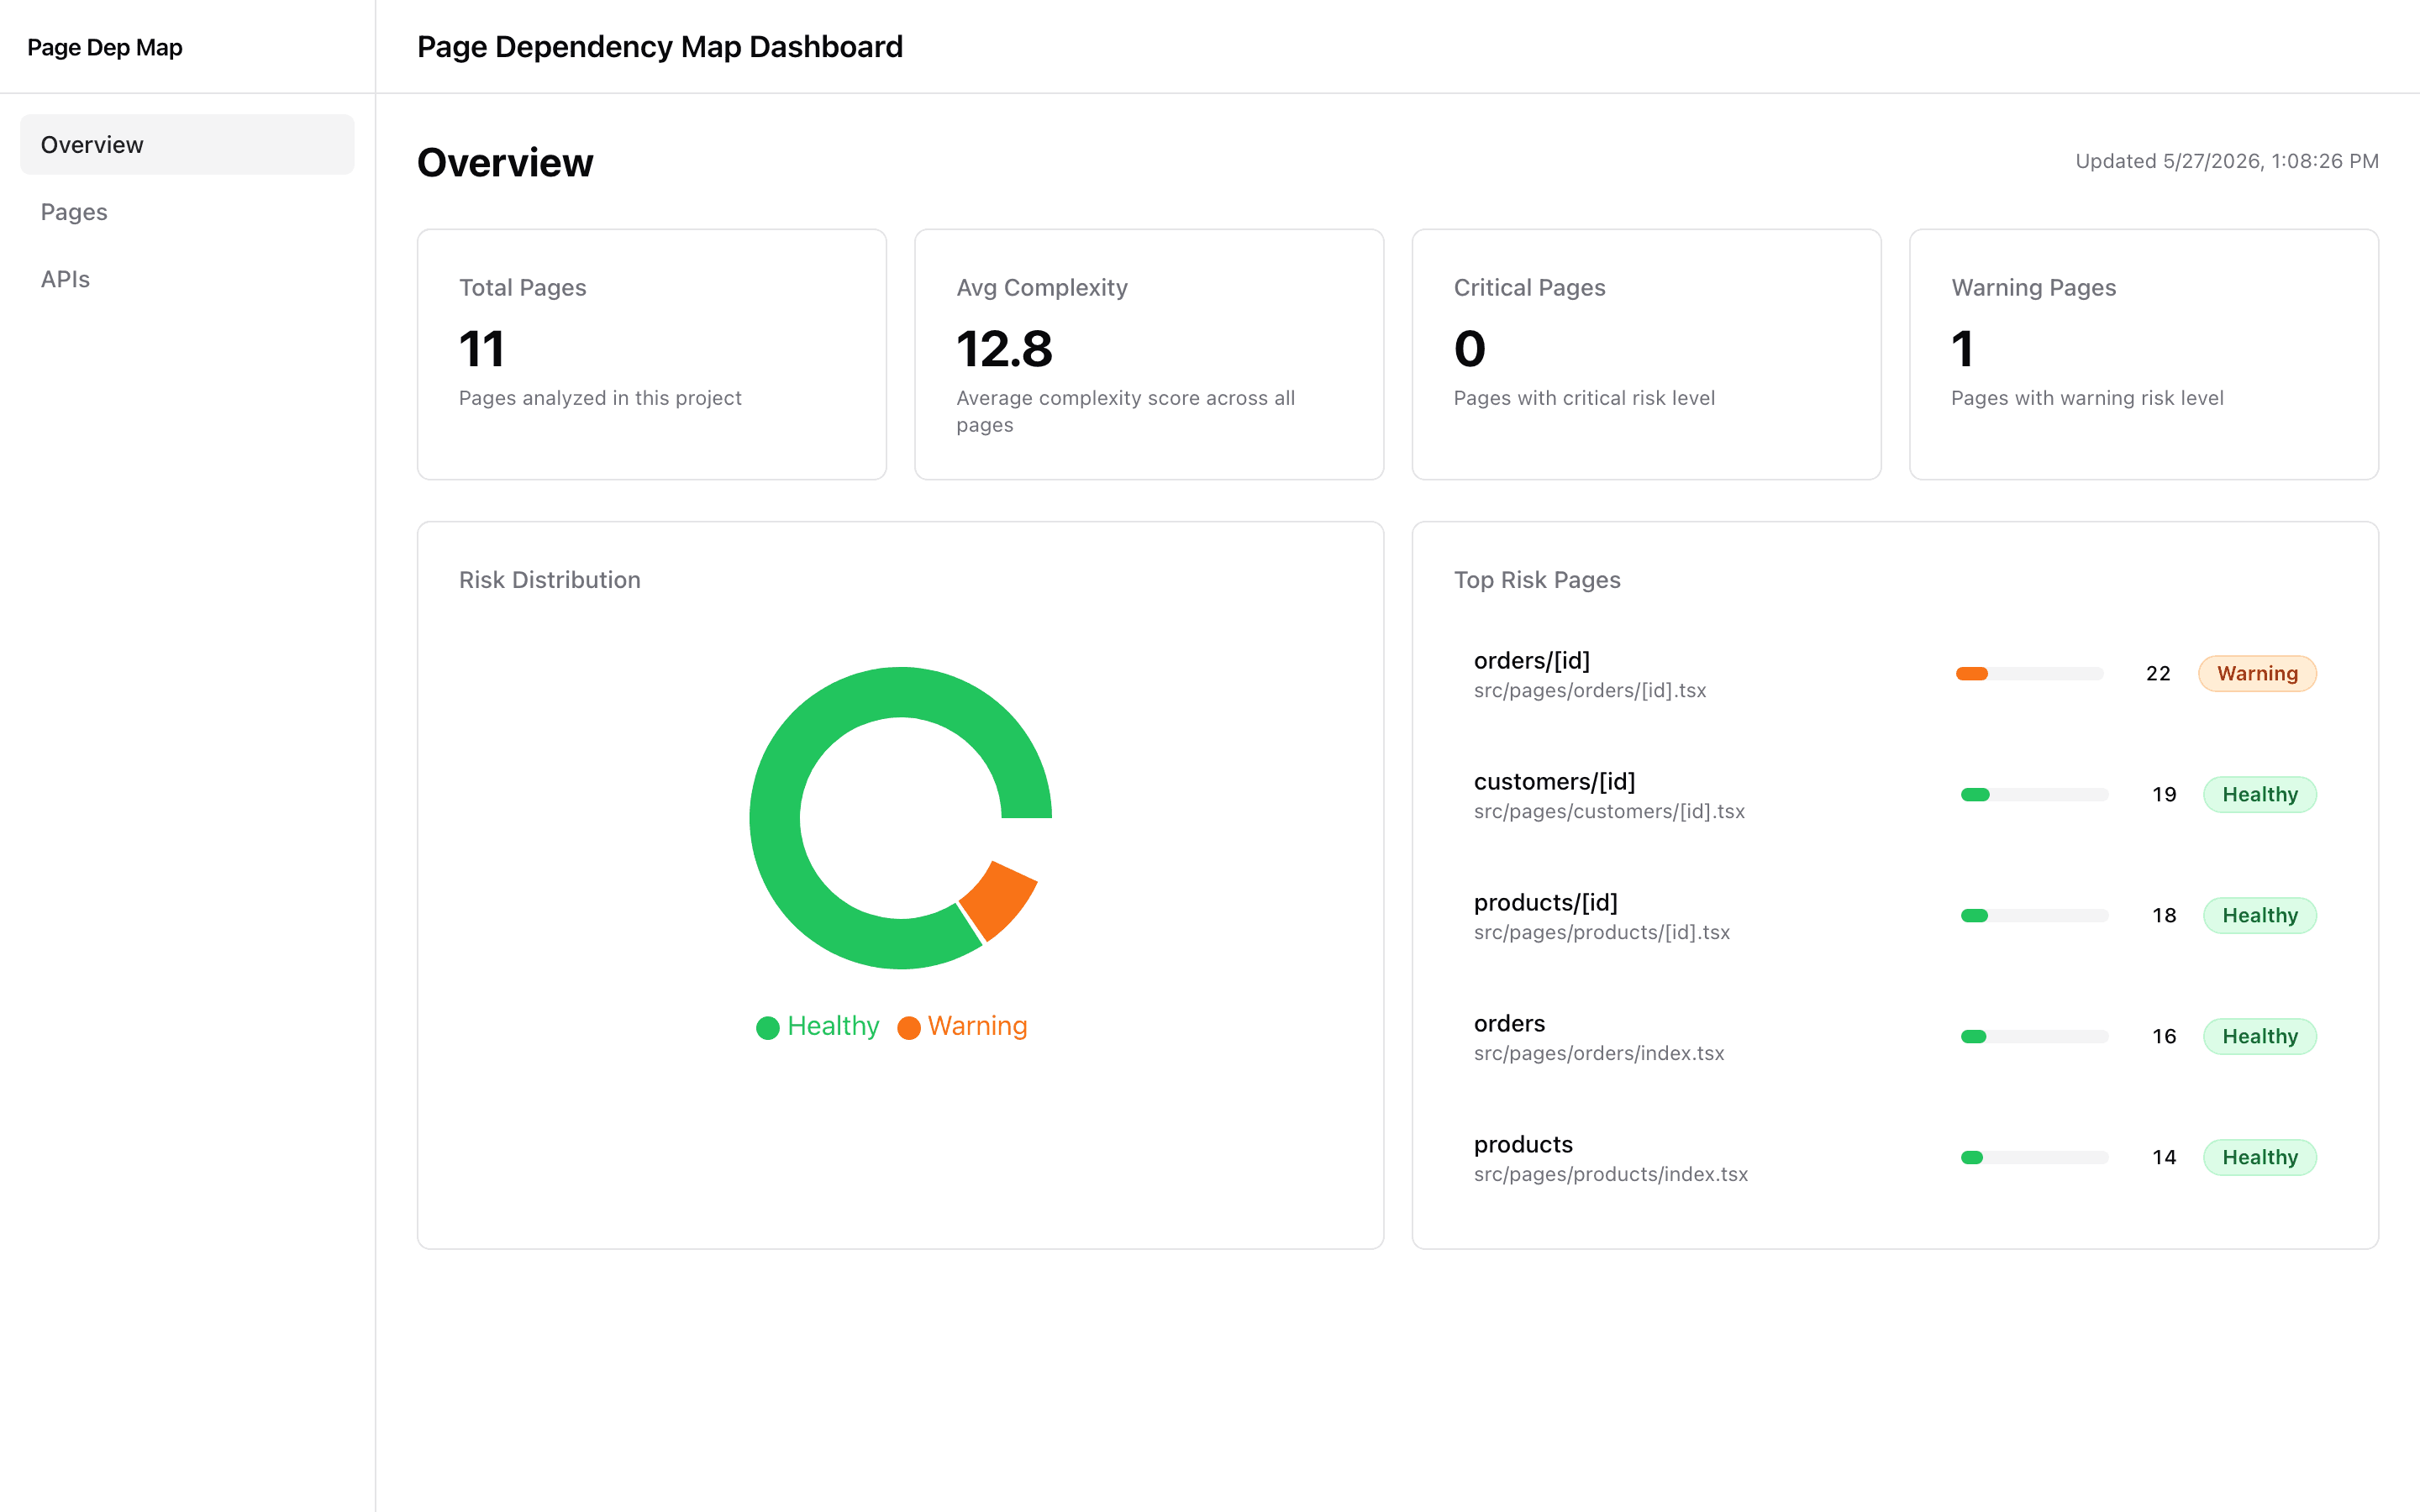
Three lenses on the same codebase, one click apart.
Static analysis tells you which page is heavy. The dashboard tells you why. Live inspect tells you where on screen.
Page-level risk scoring
Score every page on props, hooks, queries, store/context usage, conditional branches, and prop-drilling depth. Surface the pages that need refactoring first.
Component dependency map
See the full subtree under each page in an interactive modal — including external vs internal components, cycles, and reuse hotspots.
API change-impact analysis
Reverse call-graph from every endpoint to the hooks, components, and pages that reach it. One colored badge tells you whether a backend rename is safe or needs a coordination thread.
Live inspect on the running app
Click a component in the dashboard and the running React app instantly draws a red overlay on every instance. Source file & line included.
Trace any endpoint to the components that break.
Reverse call-graph from the API call site walks back through hooks, wrappers, and renderers — so a backend contract change has a visible blast radius before it lands.
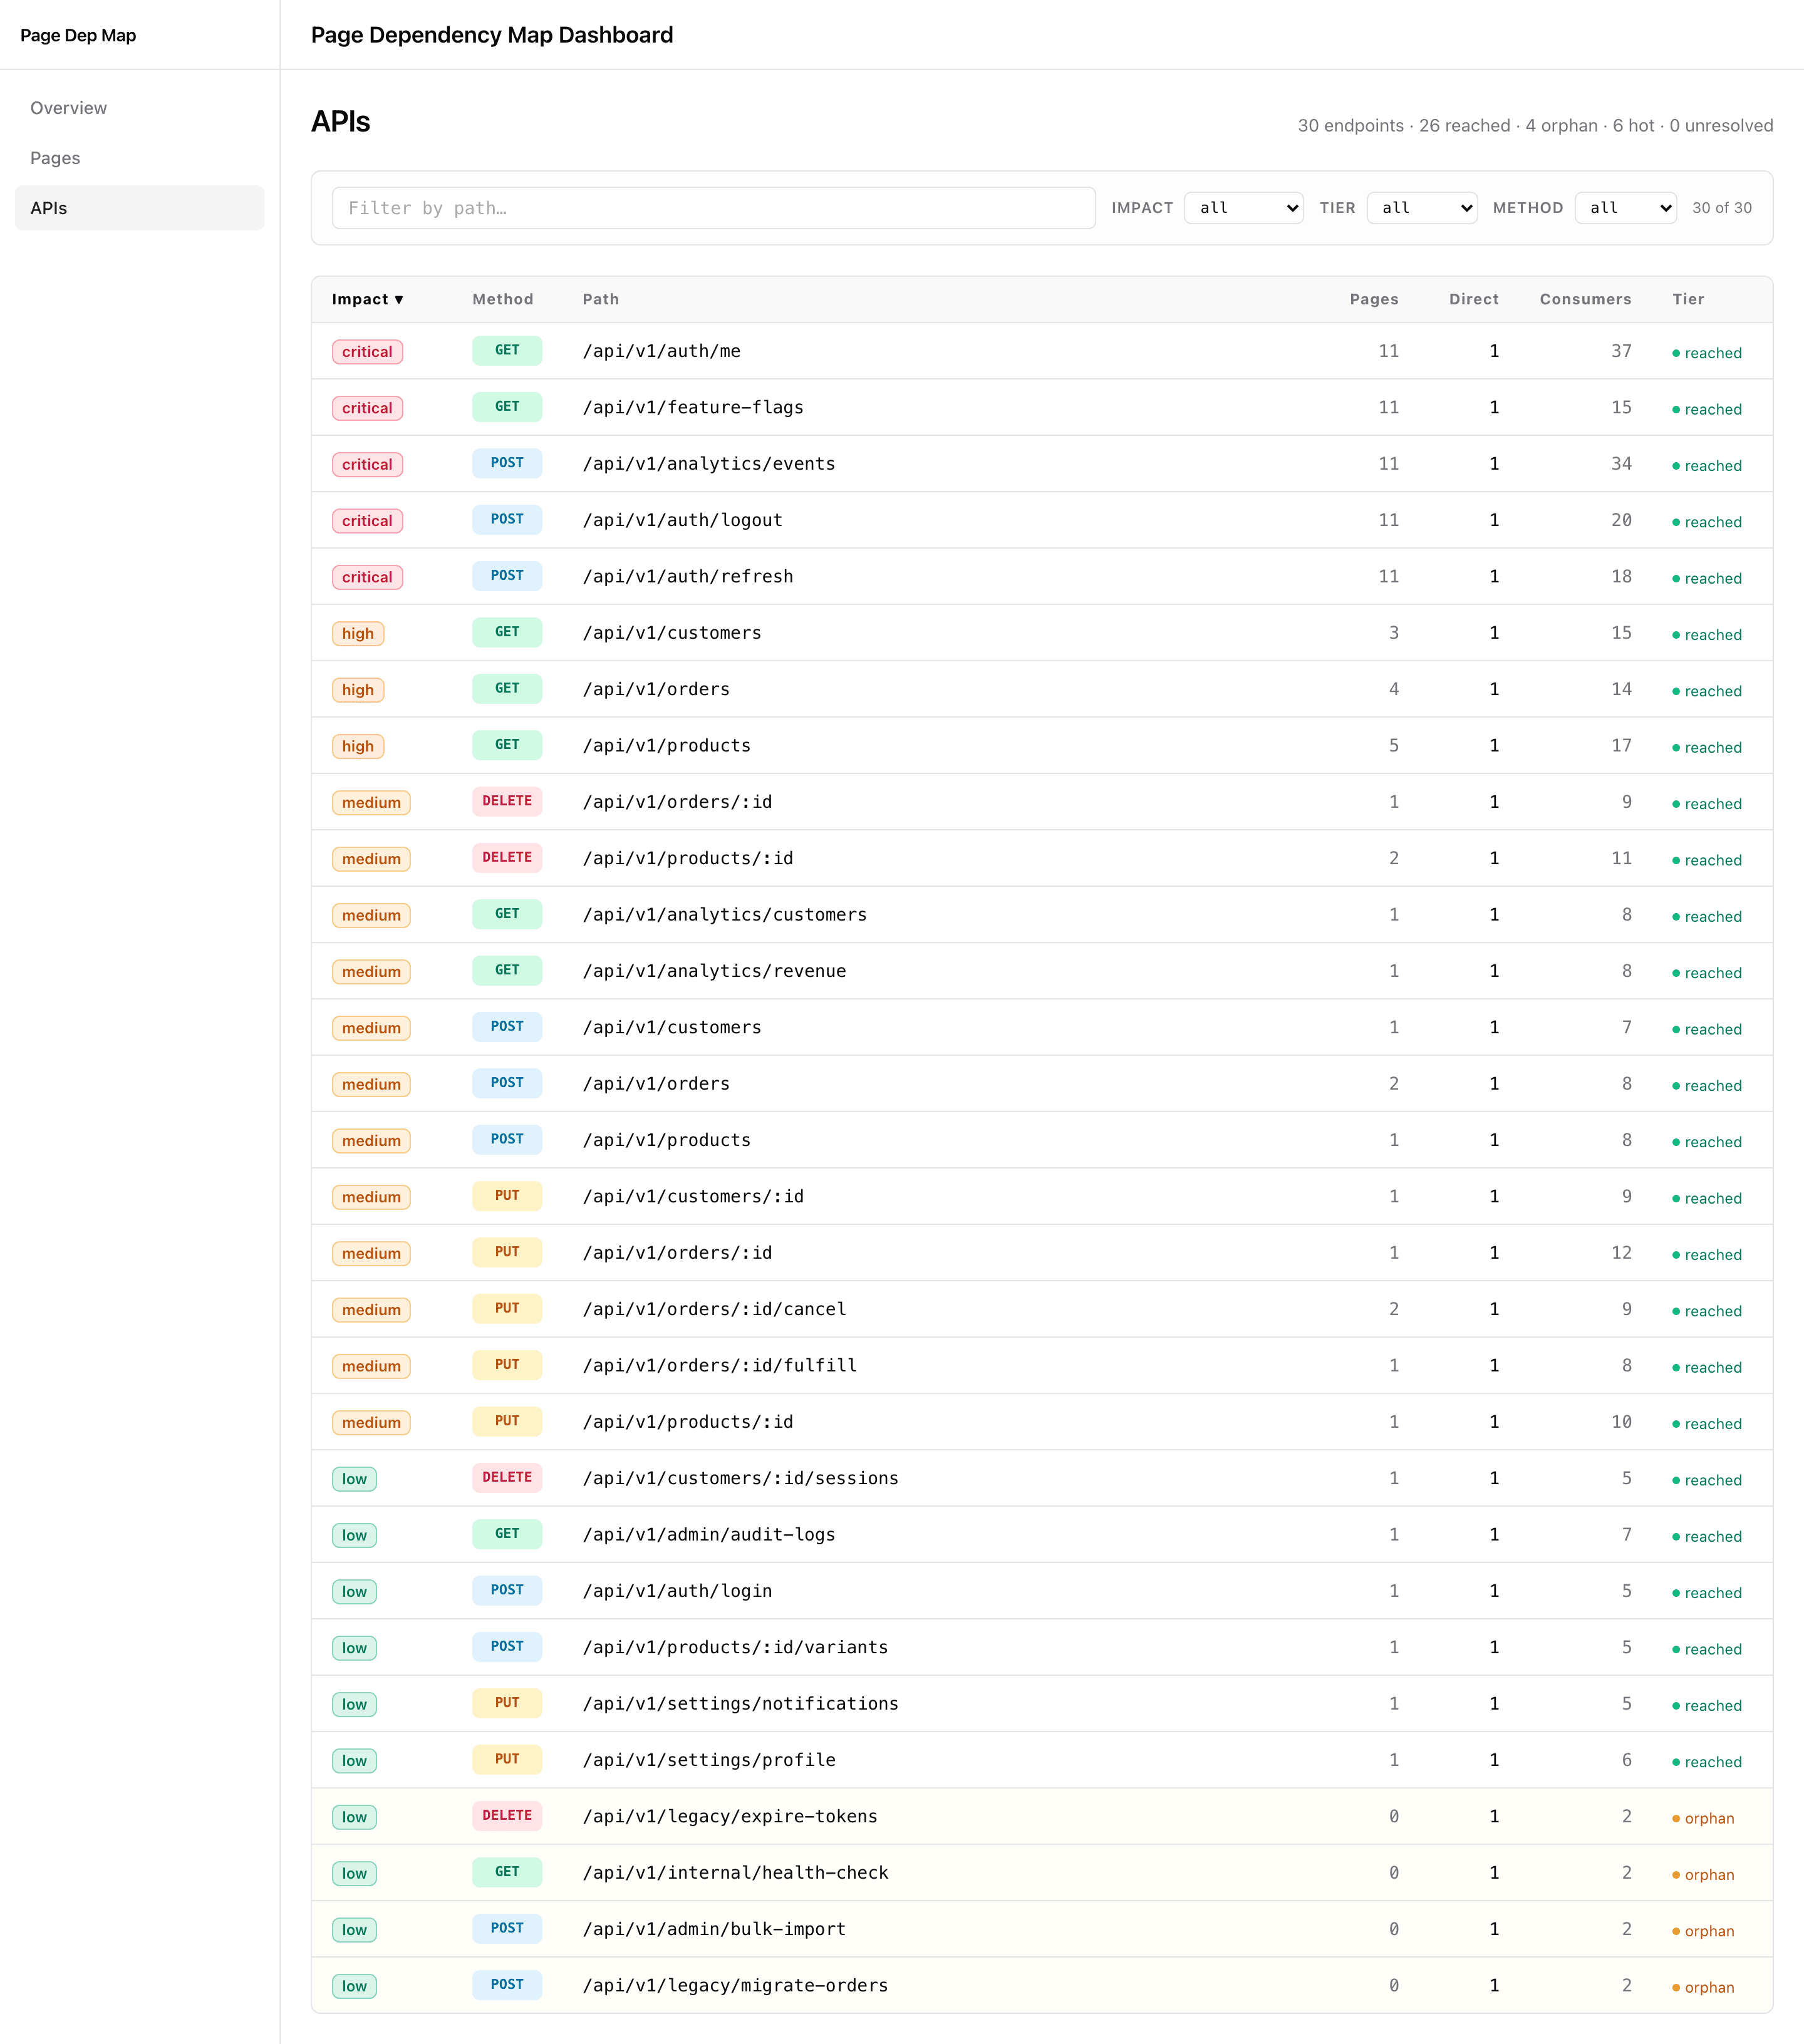
Every endpoint, scored by change risk
A reverse index of API call sites — sortable by impact, filterable by tier (reached / orphan) and HTTP method. Critical endpoints with risky-page consumers float to the top.
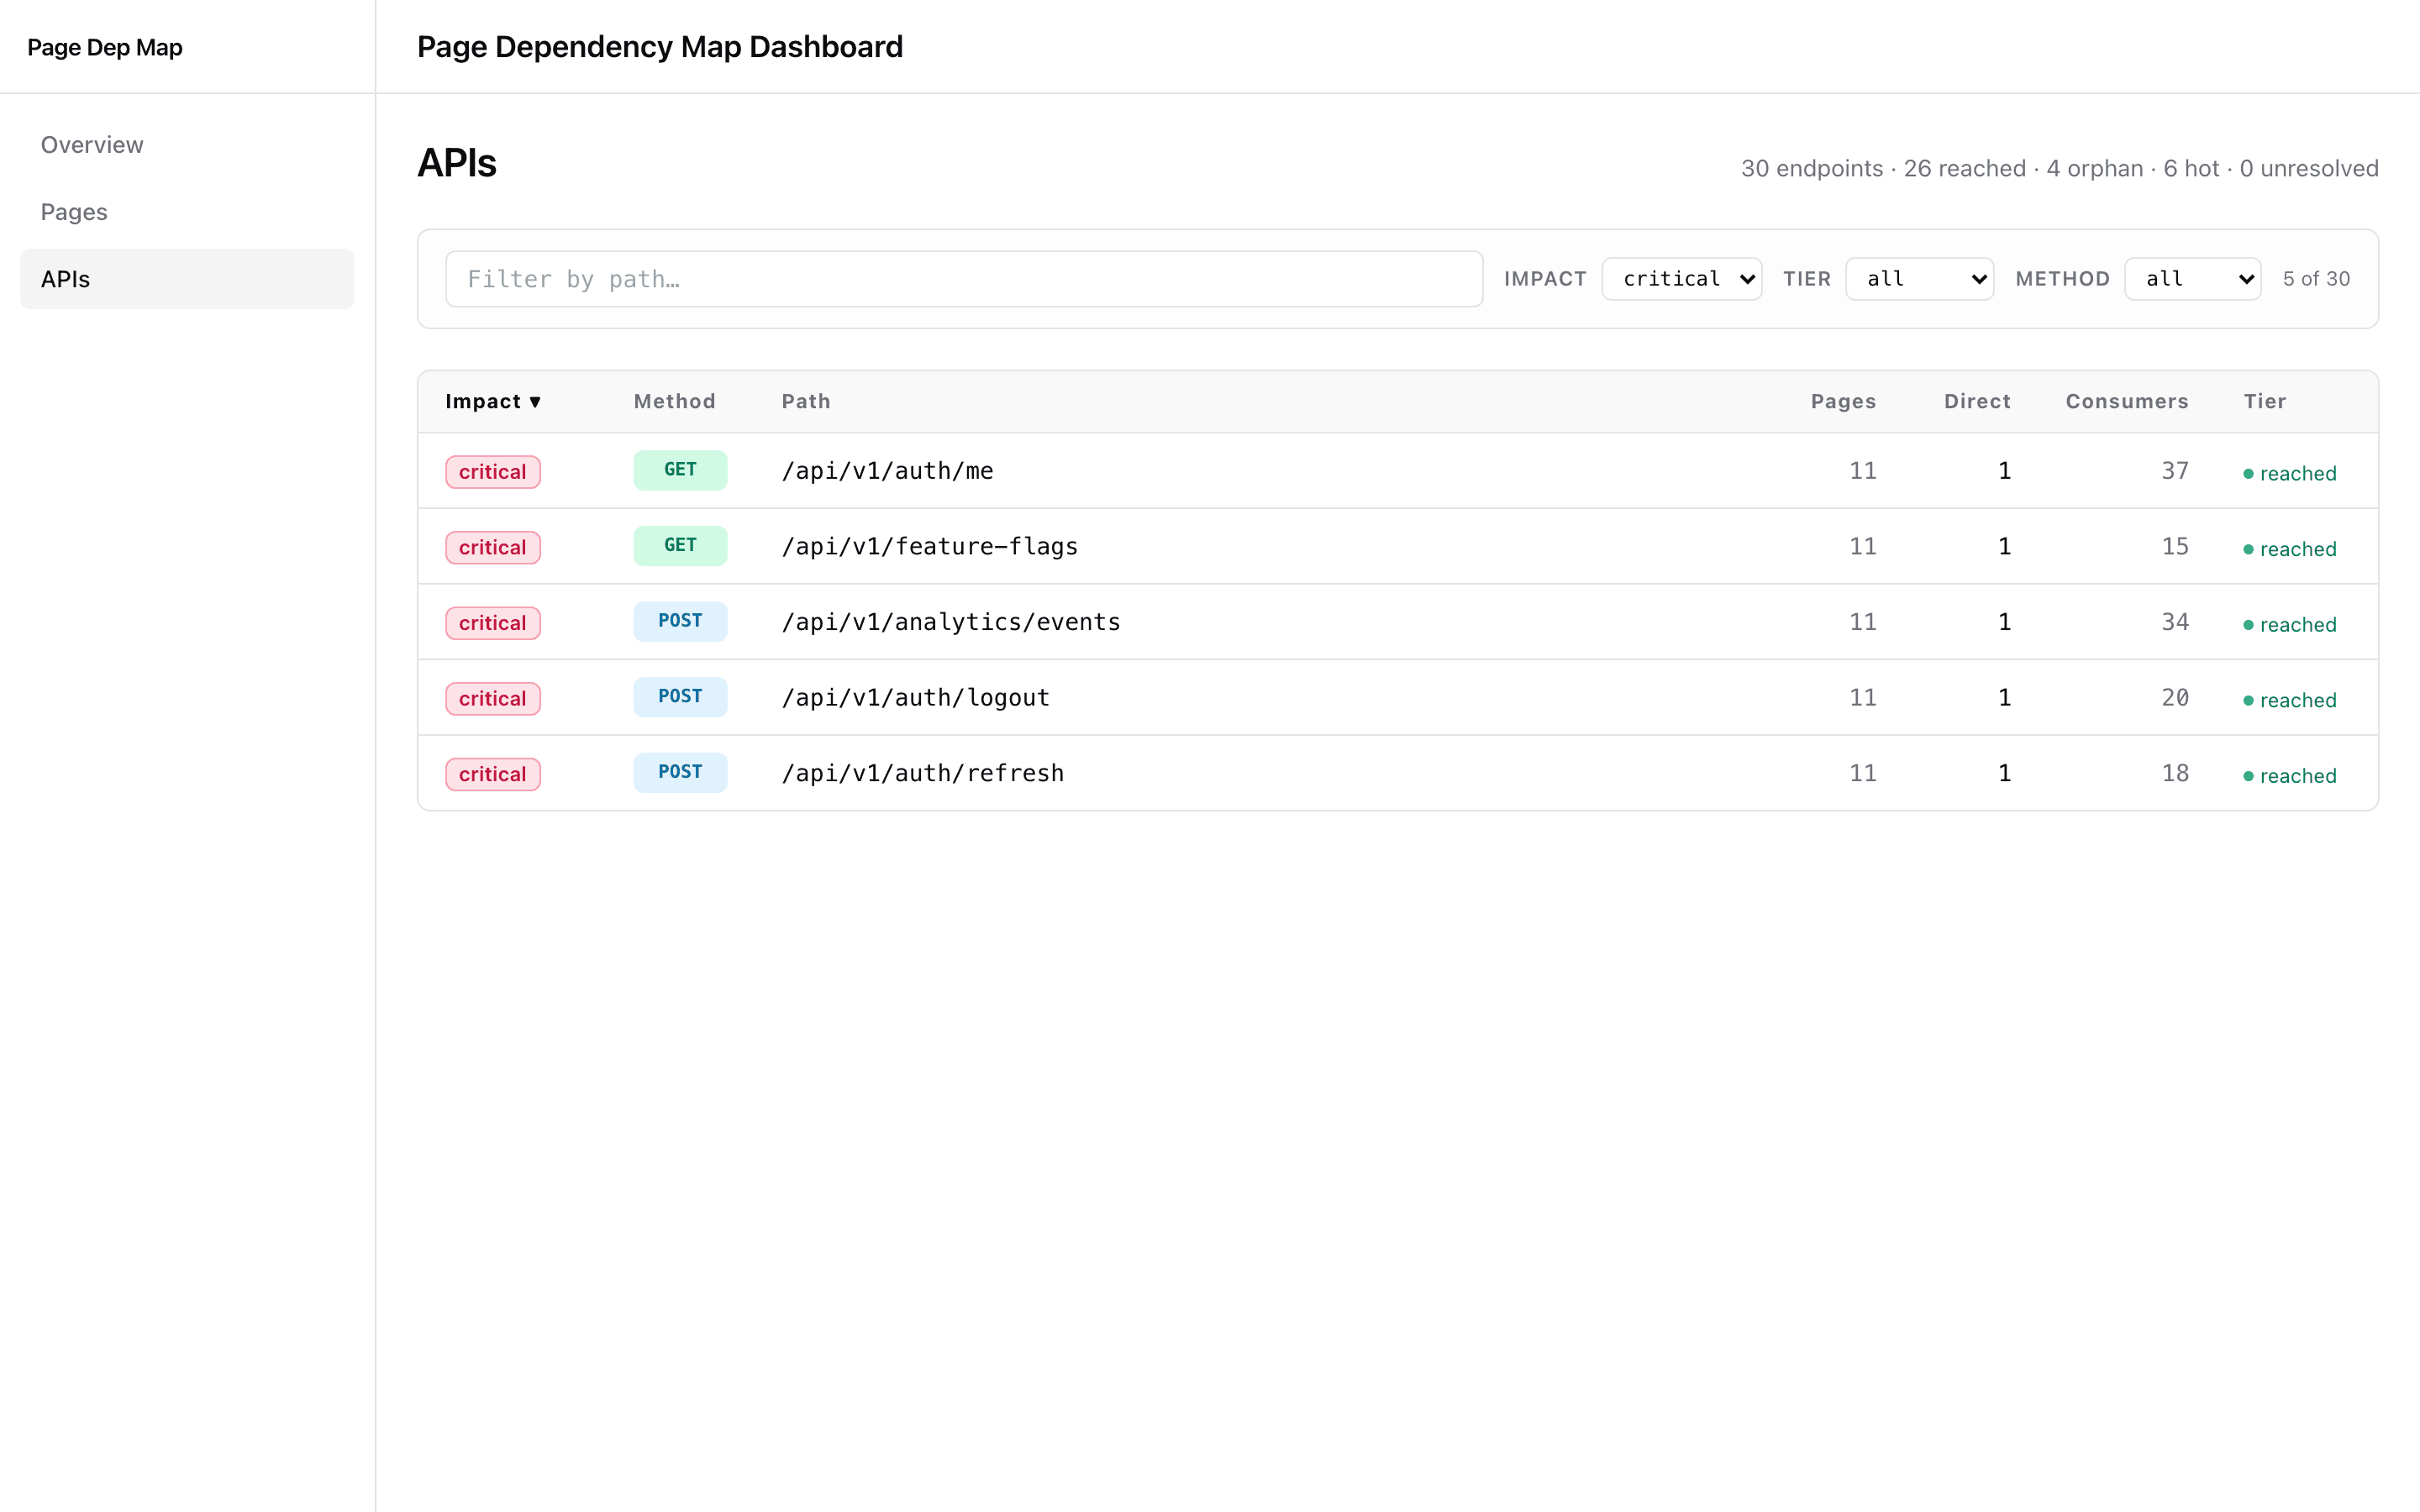
Focus the danger zone in one click
Impact = critical filter narrows 30 endpoints down to the 5 that fan out across every page. Auth, audit-log, server-date — the things a backend rename would set on fire.
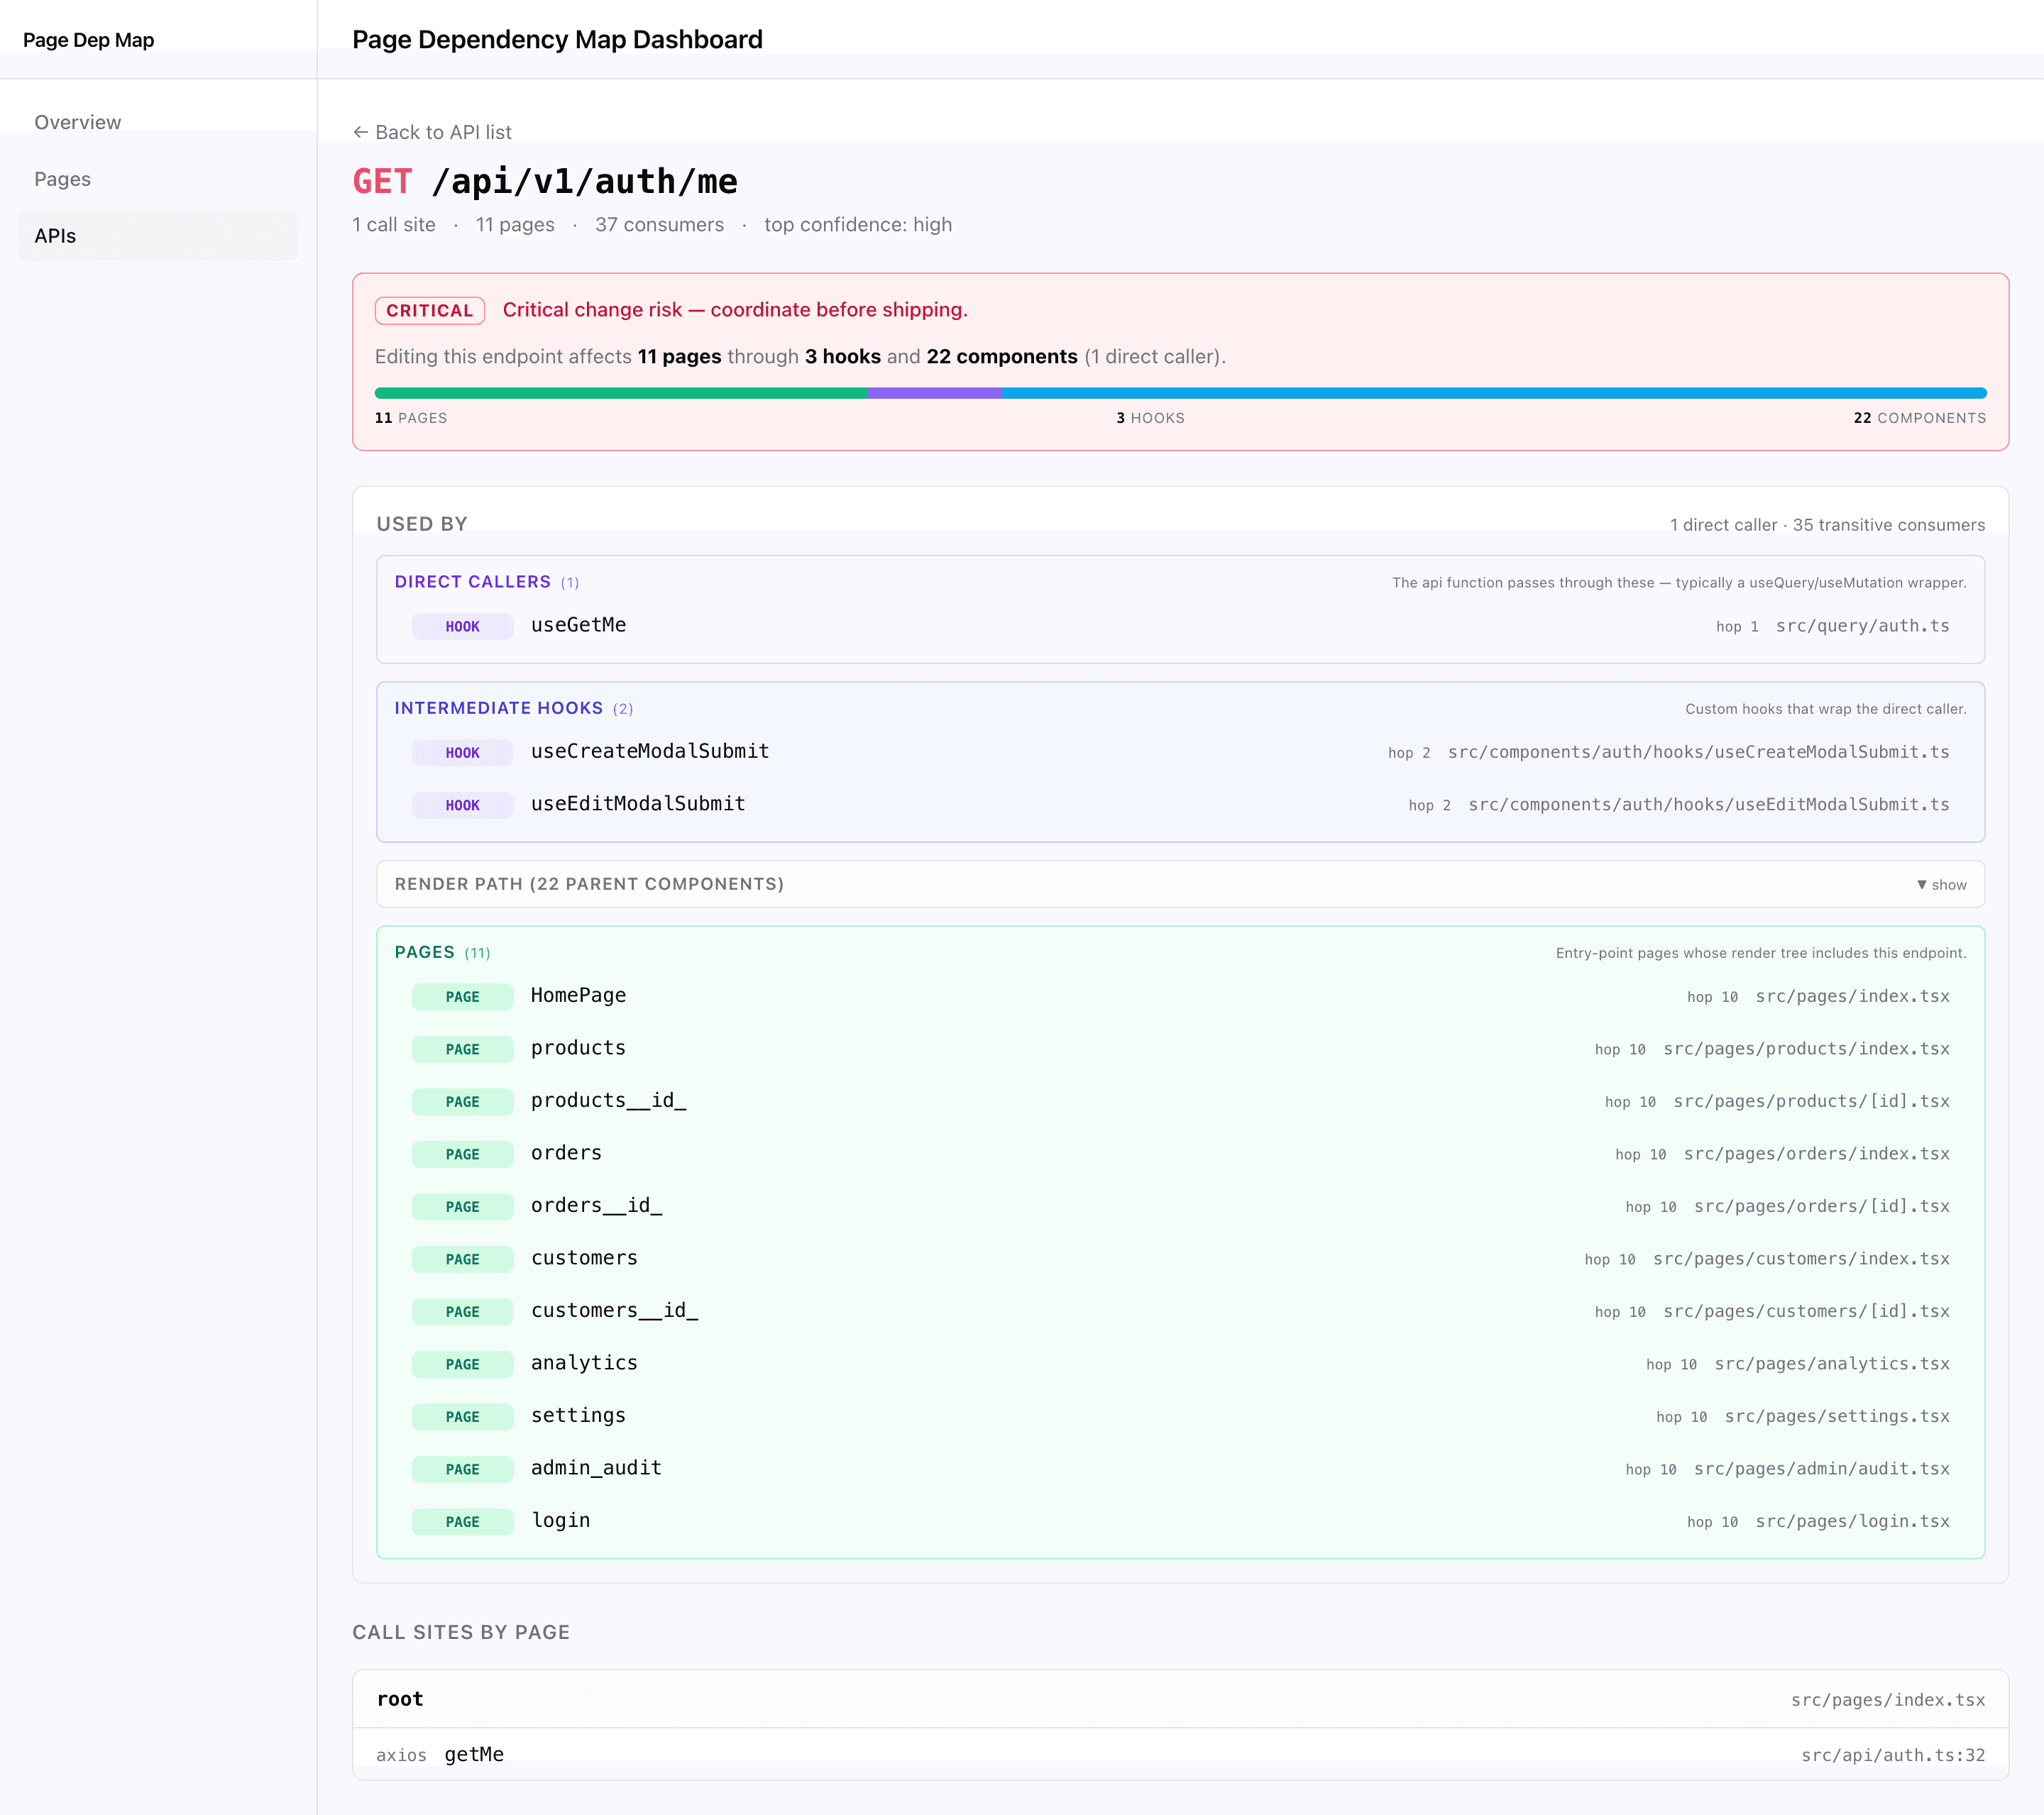
See who actually uses it
Direct callers (1-hop), intermediate hook wrappers, the first React component that touches the hook, then a collapsible render path up to the page. Backend-impact triage without grep.
From a static graph to a live red box, in three clicks.
Dashboard and your dev app talk through an SSE broker, so they don't even have to live on the same origin.
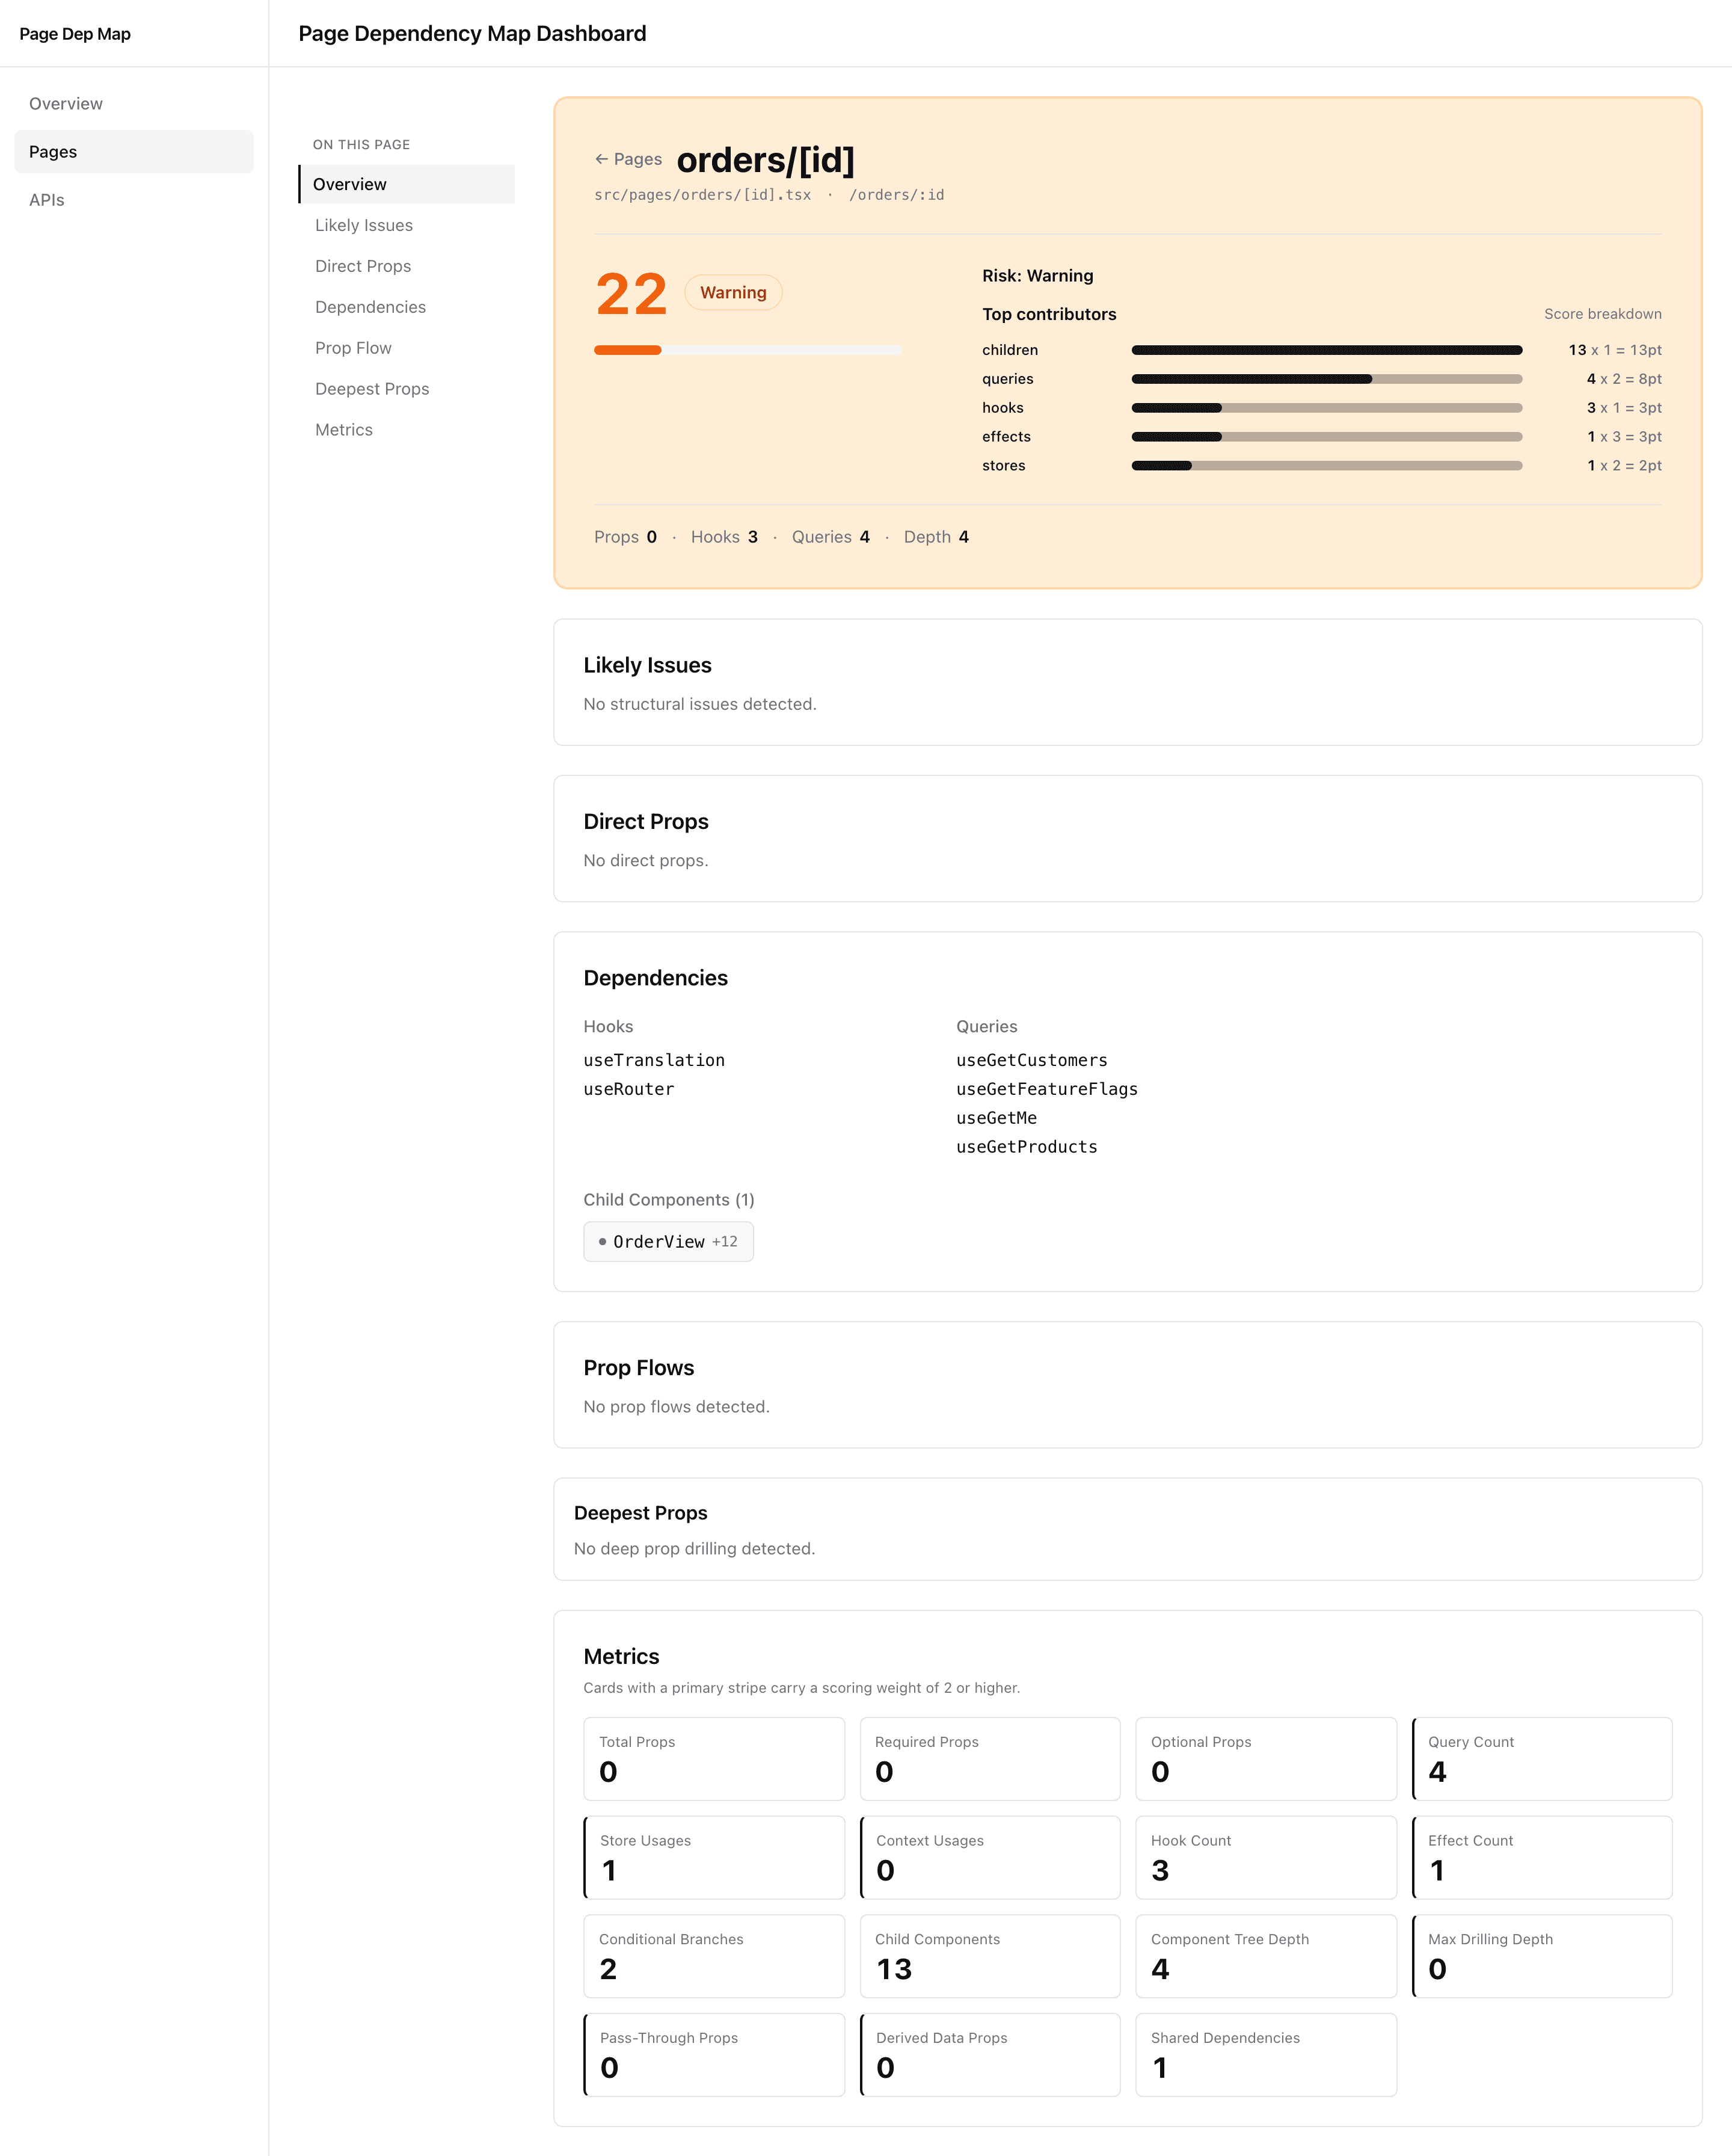
Open a page
Dashboard shows every metric for the page — props, hooks, queries, deepest prop drilling, child components.
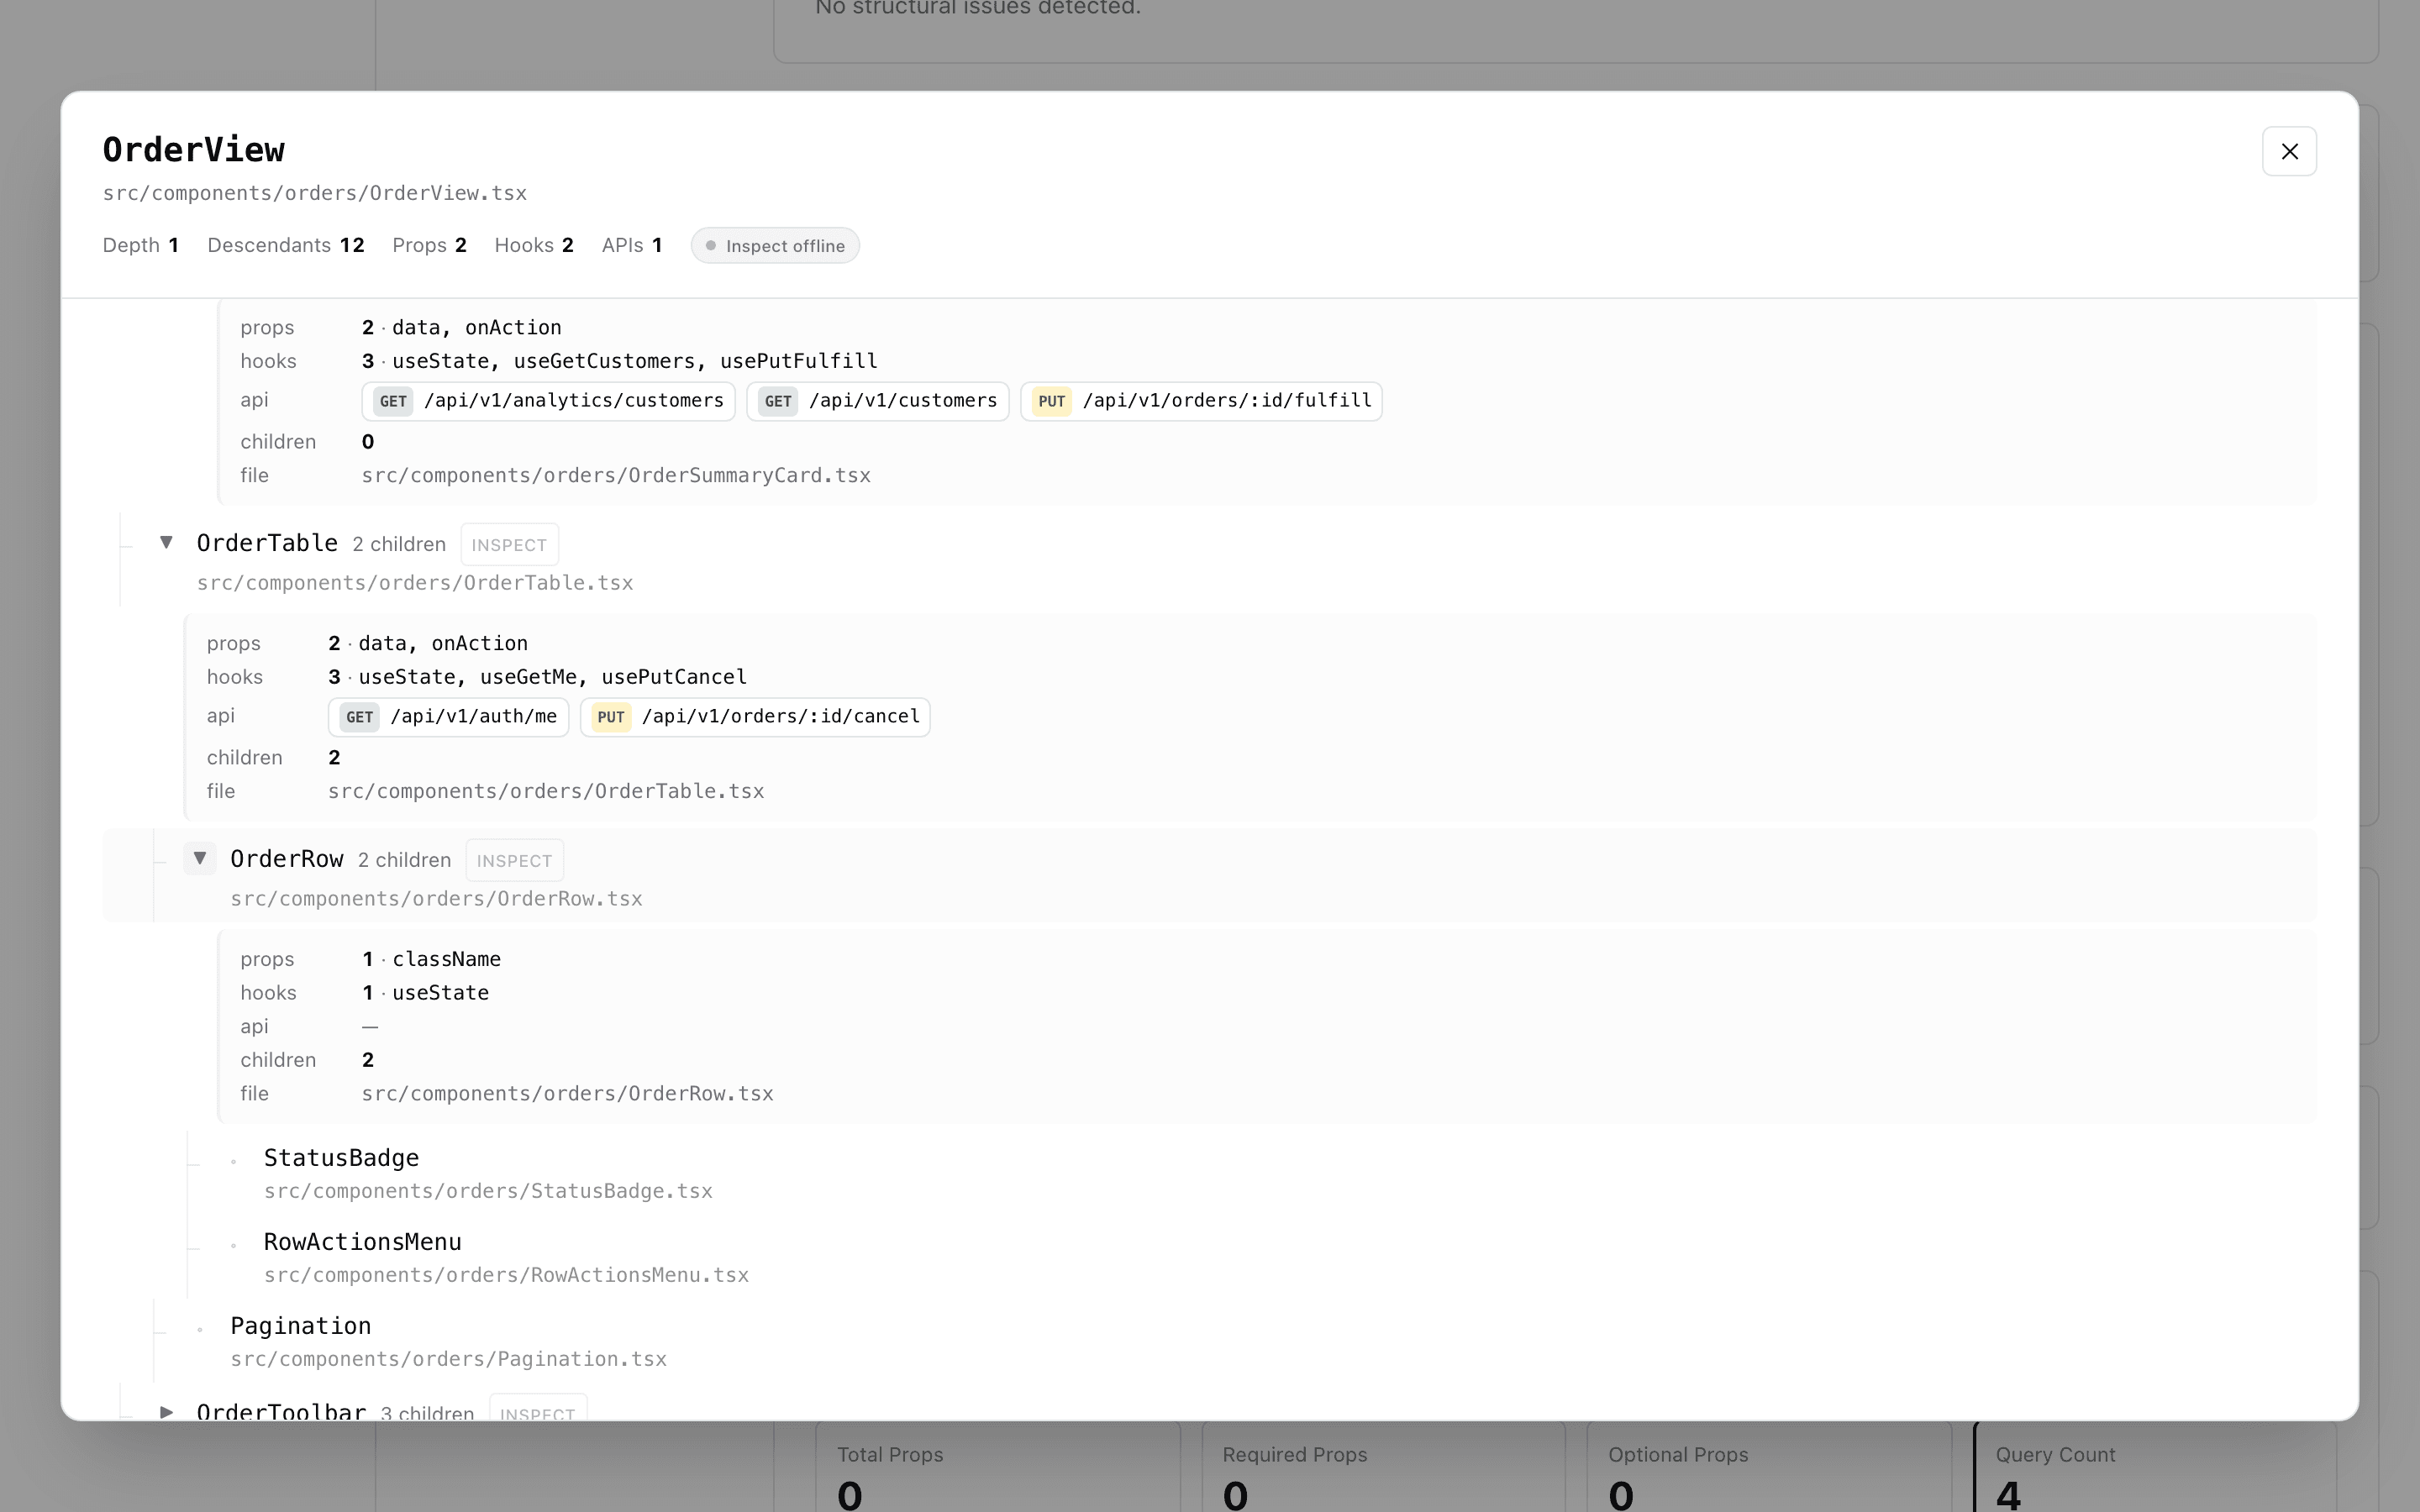
Drill into the subtree
Each component shows the exact endpoints it calls as method + path chips — and the Inspect button (parent components only) highlights it live on the page.
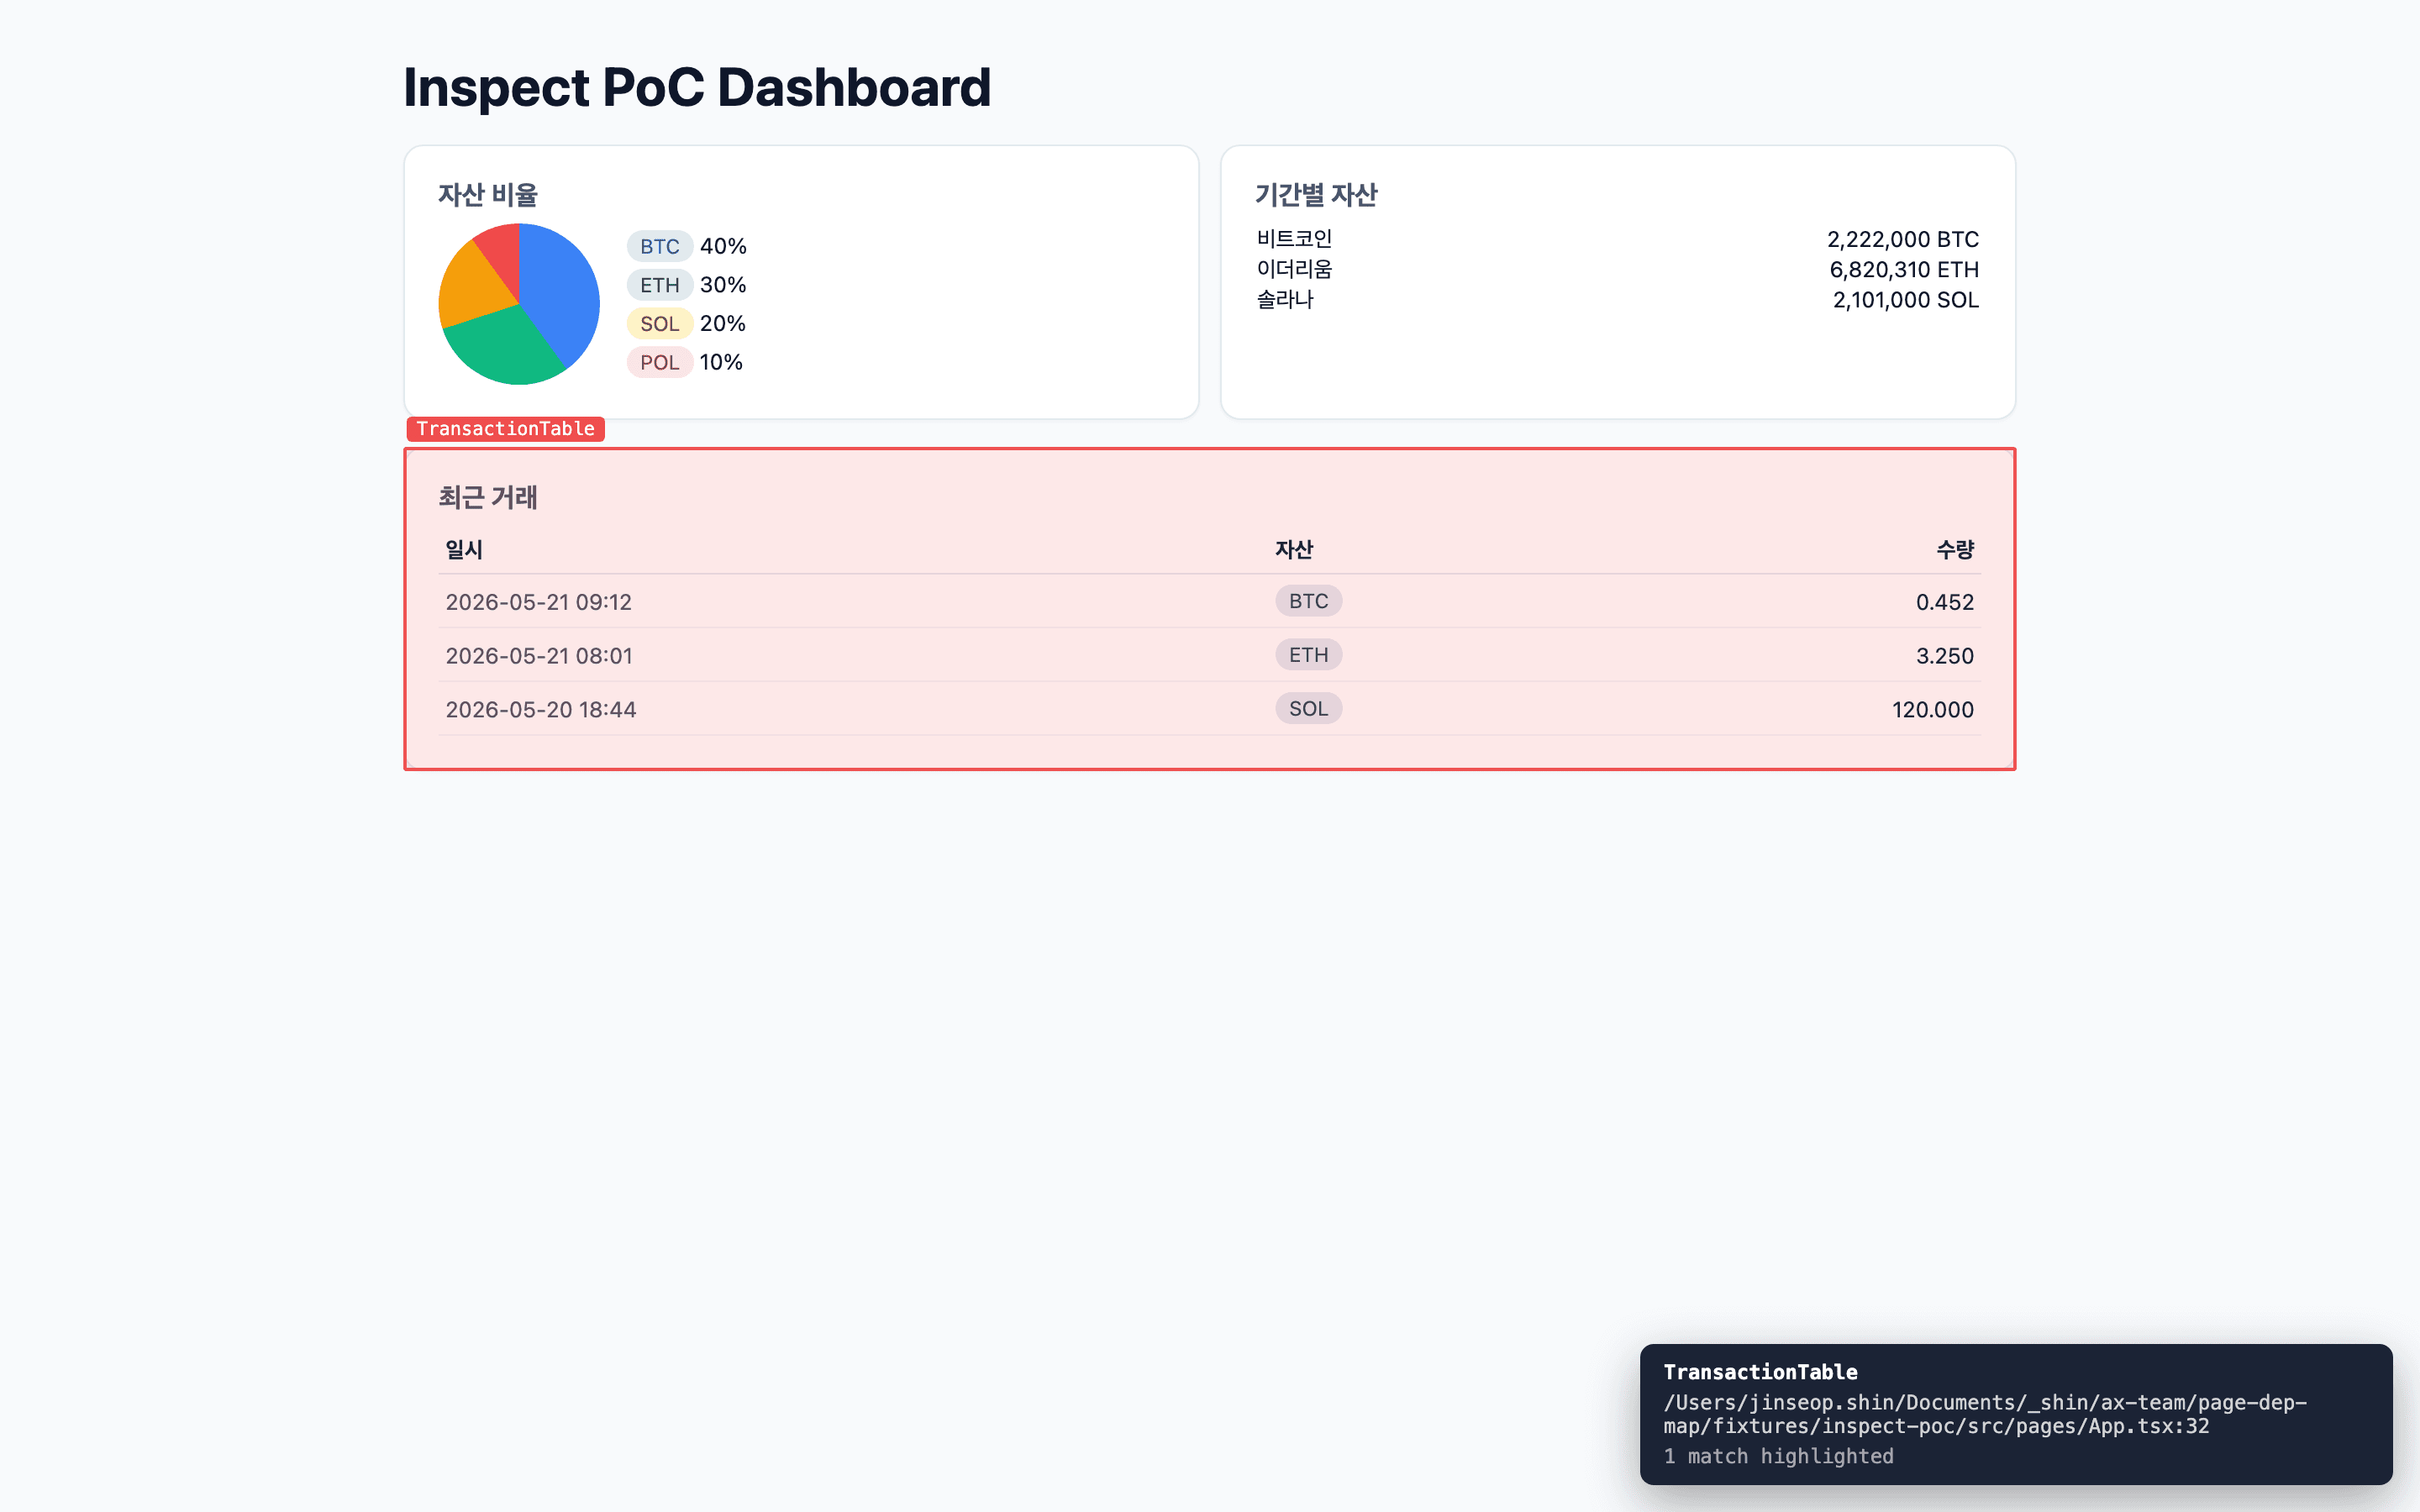
See it live on the page
Helper walks the React fiber tree, finds every instance, and overlays a red box with file + line.
Three commands to get running.
Works with Vite React, CRA, Next.js Pages / App Router, and most monorepos. TypeScript path aliases supported via tsconfig.json.
npm install -D \
  @shinjinseop/page-dep-map \
@shinjinseop/page-dep-map-vite-plugin// vite.config.ts
import pdmInspect from '@shinjinseop/page-dep-map-vite-plugin';
export default defineConfig({
plugins: [
react(),
pdmInspect({ baseUrl: 'http://localhost:3399' }),
],
});# terminal A
npx page-dep-map run .
# terminal B
npm run dev